
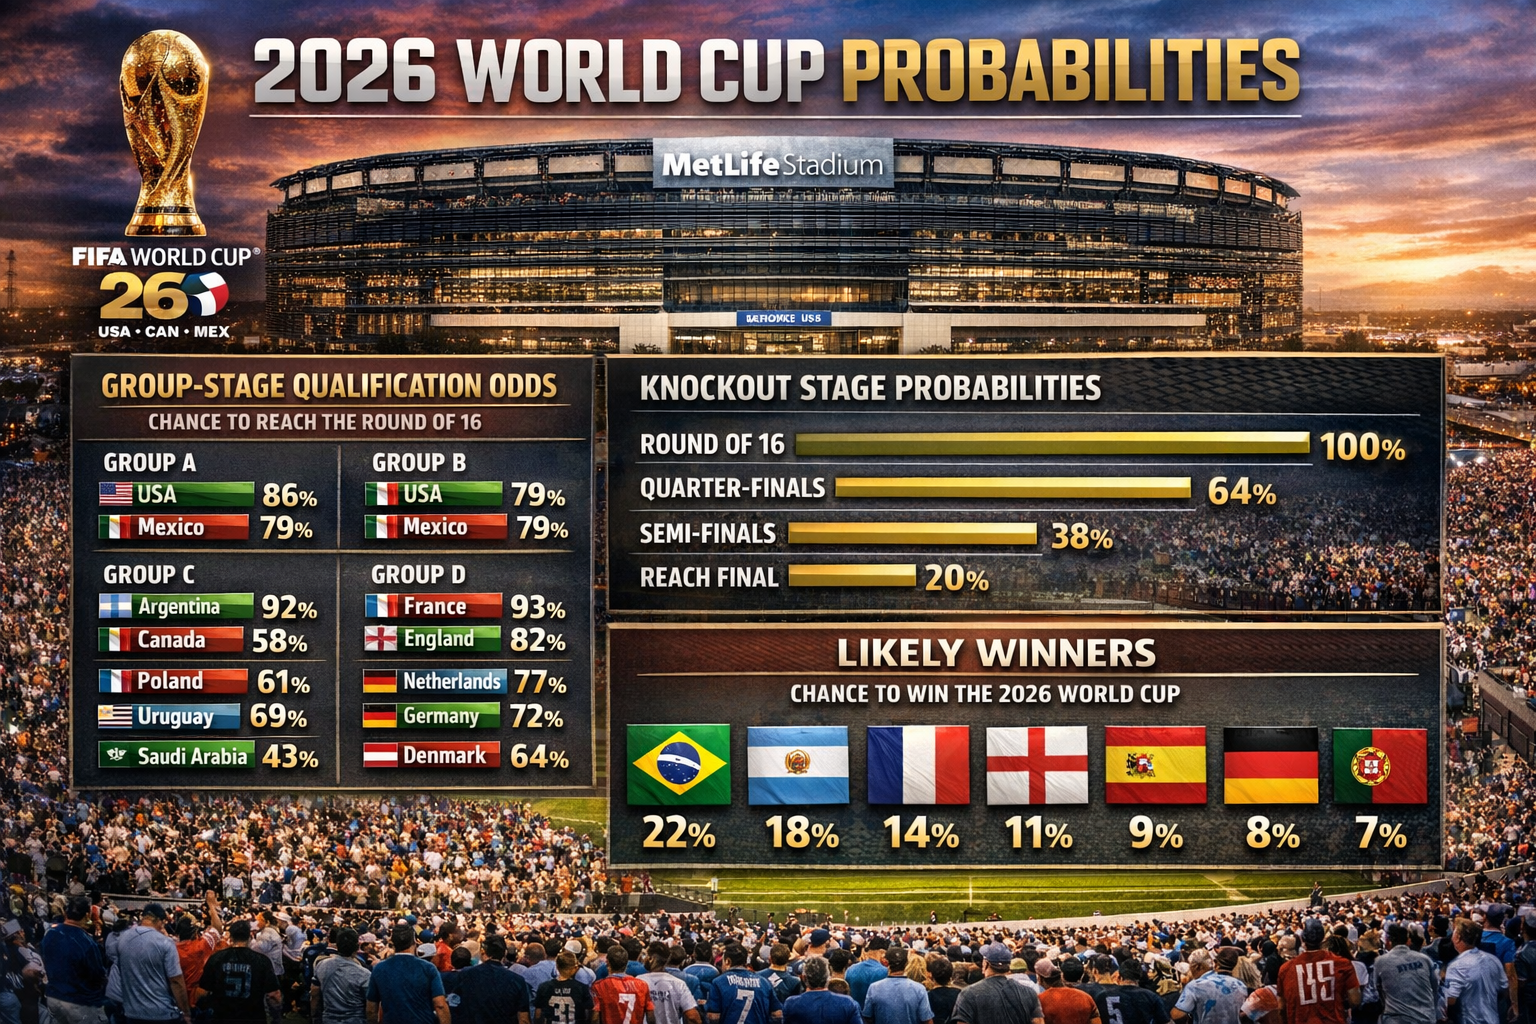
2026 World Cup simulations: group-stage qualification odds, knockout probabilities, and likely winners
This article summarises the remaining results from a set of 10,000 simulations for the 2026 FIFA World Cup, focusing on group-stage outcomes, progression probabilities through each knockout round, and who is most likely to win the tournament. The primary audience is readers who want a data-led view of tournament expectations, rather than match previews or narrative predictions.
The core problem the data addresses is simple. With a 48-team World Cup and a new knockout format, it is hard to translate team strength into realistic expectations. These simulations convert that uncertainty into percentages that describe how often each team reaches each stage, and which match-ups are most likely to occur.
What the group-stage columns mean (Qual, Elim3, NotQual)
The group-stage tables use three key outputs that are easy to misread without a definition.
“Qual” is the percentage of simulations in which a team qualified for the round of 32. This includes finishing first or second in the group, plus finishing third and still advancing as one of the best third-placed teams.
“Elim3” is the percentage of simulations in which a team finished third and did not qualify for the round of 32.
“NotQual” is the percentage of simulations in which a team was eliminated after three group matches, either by finishing last or by finishing third and missing out on best-third qualification.
Group-stage qualification odds by group (A to L)
The simulation outputs below show how often each team finishes in each position and how often each team reaches the round of 32.
Group A: Mexico lead, Denmark close, South Africa face steep odds
Mexico are the most likely Group A winner at 40.81%, and qualify in 84.41% of simulations. Denmark are next by group-winning probability at 29.24%, and qualify 76.57% of the time. South Korea sit in the middle with a 68.97% qualification rate, but also a notable 31.03% NotQual risk. South Africa have the highest elimination risk in the group, with 59.74% NotQual, and qualify in 40.26% of simulations.
Group B: Italy ahead, Switzerland and Canada competitive
Italy top Group B most often at 38.71%, qualifying 82.72% of the time. Switzerland are close, qualifying 75.09%, and Canada qualify in 69.53% of simulations, which is a meaningful advancement probability for a team that is not projected to win the group frequently. Qatar are most often fourth at 46.39%, and have 56.04% NotQual.
Group C: Brazil and Morocco dominate, Scotland often third
Brazil are the most likely group winner at 48.55%, with a very high 92.55% qualification rate. Morocco are also strong at 37.60% to win the group and 89.81% to qualify. Scotland finish third most often at 41.55%, and qualify 62.87% overall, which implies Scotland frequently rely on best-third pathways. Haiti are most often fourth at 66.84%, with 78.39% NotQual.
Group D: United States lead at home, three-way fight behind
The United States win Group D in 40.99% of simulations and qualify 83.36% of the time. Australia qualify 67.72%, Türkiye qualify 65.43%, and Paraguay qualify 54.48%. The spread suggests a group where second and third are frequently contested, and where small changes in assumed team strength would likely swing qualification odds.
Group E: Germany clear favourites, Ecuador next, tight mid-table
Germany win Group E most often at 50.21% and qualify 91.55% of the time. Ecuador qualify 80.21%, and Côte d'Ivoire qualify 66.25% with a relatively high 11.14% Elim3, meaning third place is common and sometimes not enough. Curaçao have 69.96% NotQual.
Group F: Netherlands favoured, Japan strong, Ukraine on the bubble
The Netherlands win Group F at 46.07% and qualify 86.78% of the time. Japan qualify 73.67%, while Ukraine qualify 60.29%, which is close to a coin flip once the best-third mechanism is considered. Tunisia qualify in 47.90% of simulations and have 52.10% NotQual.
Group G: Belgium lead, Iran often second, Egypt frequently third
Belgium are the most likely group winner at 51.65%, qualifying 91.81% of the time. Iran qualify 82.24% and are second most often at 34.58%. Egypt qualify 69.97%, but finish third most often at 35.28%, which again indicates reliance on best-third advancement. New Zealand have 74.71% NotQual.
Group H: Spain heavily favoured, Uruguay strong, third place is risky
Spain win Group H in 66.45% of simulations and qualify 96.91% of the time, the highest qualification rate shown in these group tables. Uruguay qualify 84.30%. Saudi Arabia qualify 43.40%, but have a high 17.22% Elim3, and Cape Verde Islands qualify 33.94% with 66.06% NotQual.
Group I: France lead, Senegal second, Norway and Iraq face high variance
France win Group I at 62.78% and qualify 94.83% of the time. Senegal qualify 75.41%. Norway qualify 56.72% with 12.97% Elim3 and 43.28% NotQual, which is a typical profile for a team often finishing third or fourth. Iraq qualify 37.68% and have 62.32% NotQual.
Group J: Argentina dominant, Austria likely second, Algeria often third
Argentina win Group J in 69.85% of simulations and qualify 96.35% of the time. Austria qualify 70.86%, and Algeria qualify 59.72% with 13.28% Elim3. Jordan qualify 35.42% and have 64.58% NotQual.
Group K: Portugal and Colombia both strong, third place is crowded
Portugal win Group K at 50.33% and qualify 92.12% of the time. Colombia win the group 34.85% of the time and qualify 85.23%. Uzbekistan qualify 46.30% with 53.70% NotQual, and Democratic Republic Congo qualify 41.09% with 58.91% NotQual.
Group L: England favoured, Croatia strong, Ghana likely fourth
England win Group L at 54.35% and qualify 93.99% of the time. Croatia qualify 85.19%. Panama qualify 57.78% and finish third most often at 38.75%, meaning best-third qualification is central to their pathway. Ghana have 72.58% NotQual.
Who is most likely to win their group?
Group-winning probability is a useful shorthand for who tends to control a group, because it is less forgiving than “Qual”. The leading group-win probabilities are:
- Argentina (Group J): 69.85%
- Spain (Group H): 66.45%
- France (Group I): 62.78%
- England (Group L): 54.35%
- Belgium (Group G): 51.65%
- Portugal (Group K): 50.33%
- Germany (Group E): 50.21%
- Brazil (Group C): 48.55%
Knockout progression odds: round of 32 to final
Progression probabilities show the percentage of simulations where each team reaches a given stage. These numbers are not match predictions. They are aggregate outcomes across the simulated tournament paths.
Round of 32: highest probabilities to reach the first knockout round
The highest probabilities to reach the round of 32 are:
- France: 68.89%
- Spain: 64.95%
- England: 64.67%
- Argentina: 63.78%
- Portugal: 57.68%
- Belgium: 57.02%
- Brazil: 54.71%
- Germany: 53.37%
Round of 16: who most often makes the last 16
The leading round of 16 probabilities are:
- France: 46.80%
- Argentina: 44.13%
- Spain: 43.81%
- England: 39.65%
- Portugal: 34.19%
- Brazil: 32.44%
Quarter-finals and semi-finals: the most common deep runs
The highest quarter-final probabilities are:
- France: 30.61%
- Spain: 29.49%
- Argentina: 29.21%
- England: 24.48%
The highest semi-final probabilities are:
- Spain: 18.55%
- France: 17.93%
- Argentina: 17.88%
- England: 13.85%
Final and tournament winner probabilities
The simulation’s top tournament winner probabilities are:
- Spain: 11.21%
- Argentina: 10.82%
- France: 10.26%
- England: 7.48%
- Portugal: 5.31%
- Brazil: 4.93%
- Netherlands: 4.44%
- Belgium: 4.40%
- United States: 3.33%
- Germany: 3.28%
The data labels several teams as “repeat winner”, meaning they have won the World Cup before. Those are Spain, Argentina, France, England, Brazil, Germany, Italy, and Uruguay.
Most likely knockout match-ups (why these pairings keep appearing)
Match-up probabilities reflect how the group tables combine with the bracket structure. A match-up can be common because both teams frequently qualify, because they often finish in specific group positions that feed into each other, or because the best-third placements repeatedly funnel teams into the same slots.
In the round of 32, the most common overall match-ups include:
- Argentina v Uruguay: 35.75%
- Argentina v Spain: 31.21%
- Brazil v Netherlands: 28.11%
- Morocco v Netherlands: 27.49%
- Austria v Spain: 27.45%
- Colombia v Croatia: 23.58%
- Croatia v Portugal: 22.54%
- Brazil v Japan: 22.39%
By the quarter-finals, the match-up distribution narrows, and the most common overall quarter-final pairing is:
- Argentina v Portugal: 8.08%
Other high-frequency quarter-final pairings include:
- Belgium v Spain: 6.82%
- France v Netherlands: 6.36%
- Argentina v Italy: 5.31%
- Brazil v England: 5.00%
In the semi-finals, the most common overall pairing is:
- France v Spain: 5.50%
Repeat winner vs new winner: what the simulation implies
A repeat winner is a country that has already won the World Cup. A new winner is a country that has never won the World Cup.
The simulation reports:
- Repeat Winner: 53.29%
- New Winner: 46.71%
The source also notes the historical context of previous World Cup winners as: Brazil (5), Germany/West Germany (4), Italy (4), Argentina (3), France (2), Uruguay (2), Spain (1), England (1).
The source text states: “Obviously Portugal, the Netherlands, Belgium, the United States (surprisingly, probably because they're playing at home) and Croatia have the biggest chances to be that new winner, and Morocco are the most likely to break the Europe/South America stranglehold. In terms of dark horses, you have to look at Norway whose chances in the simulation are limited due to their FIFA ranking, with their recent rise (43rd to 29th place since last year) probably set to continue, or will it?” (source text)
Confederation winner probabilities (and what they mean)
A confederation winner probability is the percentage of simulations where the eventual champion comes from a given football confederation. The simulation results are:
- UEFA: 59.04% (12 wins)
- CONMEBOL: 21.93% (10 wins)
- CONCACAF: 6.95% (0 wins)
- CAF: 6.59% (0 wins)
- AFC: 5.47% (0 wins)
- OFC: 0.02% (0 wins)
The bracketed figures are described as the number of wins to date between 1930 to 2022.
How to use these probabilities in practice
These outputs are most useful when you treat them as a planning tool rather than a certainty engine.
- Use “Qual” to set baseline expectations for whether a team is more likely than not to reach the knockout phase.
- Use group-win probability to understand bracket power, because finishing first often changes the calibre of opponent in the round of 32.
- Use round-by-round progression to compare teams with similar group odds, because some teams qualify often but have low conversion into quarter-finals.
- Use match-up frequencies to anticipate likely fixtures, especially when planning coverage, travel, or scenario analysis.
What could change next (and why these numbers are not fixed)
These results are a snapshot of a particular simulation set. Any changes to the underlying assumptions will change the outputs. The most common drivers of change are team-strength inputs, seeding assumptions, and how the model treats uncertainty.
The source text explicitly flags one practical example of why a team’s probability might change over time. Norway’s chances are described as limited by FIFA ranking, while Norway’s ranking movement is described as “43rd to 29th place since last year” (source text). If a model uses rankings as a key strength input, then ranking updates can materially shift qualification and deep-run probabilities.
Takeaway model: a simple way to read the simulation
A reusable way to interpret the results is the Three-Layer Tournament Expectation Model.
- Entry layer (Qual, NotQual): How often a team reaches the round of 32.
- Conversion layer (Round of 16, Quarter-final): How often a team turns qualification into a deep run.
- Title layer (Final, Winner): How often a team converts a deep run into a trophy.
This framework helps you avoid overvaluing teams that qualify frequently but rarely convert, and undervaluing teams that qualify slightly less often but have stronger conversion once in the bracket.
FAQ
What does “Qual” mean in the group-stage simulation tables?
“Qual” is the percentage of simulations where a team qualified for the round of 32, either by finishing first or second in the group, or by qualifying as one of the best third-placed teams.
What does “Elim3” mean?
“Elim3” is the percentage of simulations where a team finished third in the group but did not qualify for the round of 32.
What does “NotQual” mean?
“NotQual” is the percentage of simulations where a team was eliminated after the group stage, either by finishing last or by finishing third and failing to qualify as a best third-placed team.
Who are the most likely winners in this simulation?
The highest tournament winner probabilities are Spain (11.21%), Argentina (10.82%), France (10.26%), and England (7.48%).
What is the chance of a new World Cup winner according to the simulation?
The simulation reports a New Winner probability of 46.71% and a Repeat Winner probability of 53.29%.
Which confederation is most likely to produce the winner?
UEFA is most likely at 59.04%, followed by CONMEBOL at 21.93%.